Plot method for harmbound objects produced by getHarmBound
Source: R/harmbound_plot.R
plot.harmbound.RdPlot method for harmbound objects produced by getHarmBound
# S3 method for class 'harmbound'
plot(x, which = "bounds", ...)
Arguments
Examples
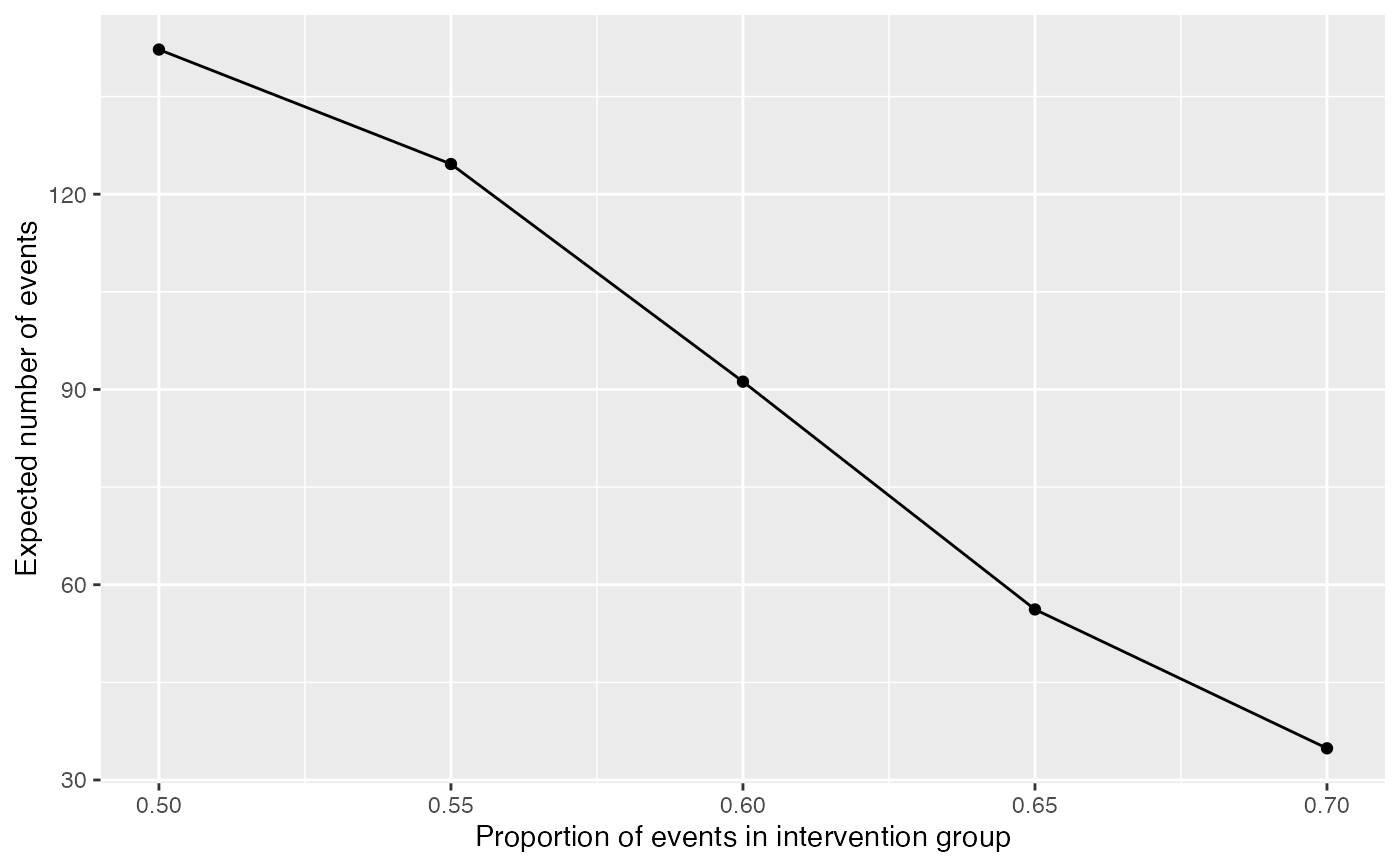
harmbound<-getHarmBound(nevents = seq(10, 100, by=10),alpha_test = 0.025,
pH0 = 0.5, pH1 = seq(0.55,0.7,by=0.05), maxevents = 150)
plot(harmbound, which = "bounds")
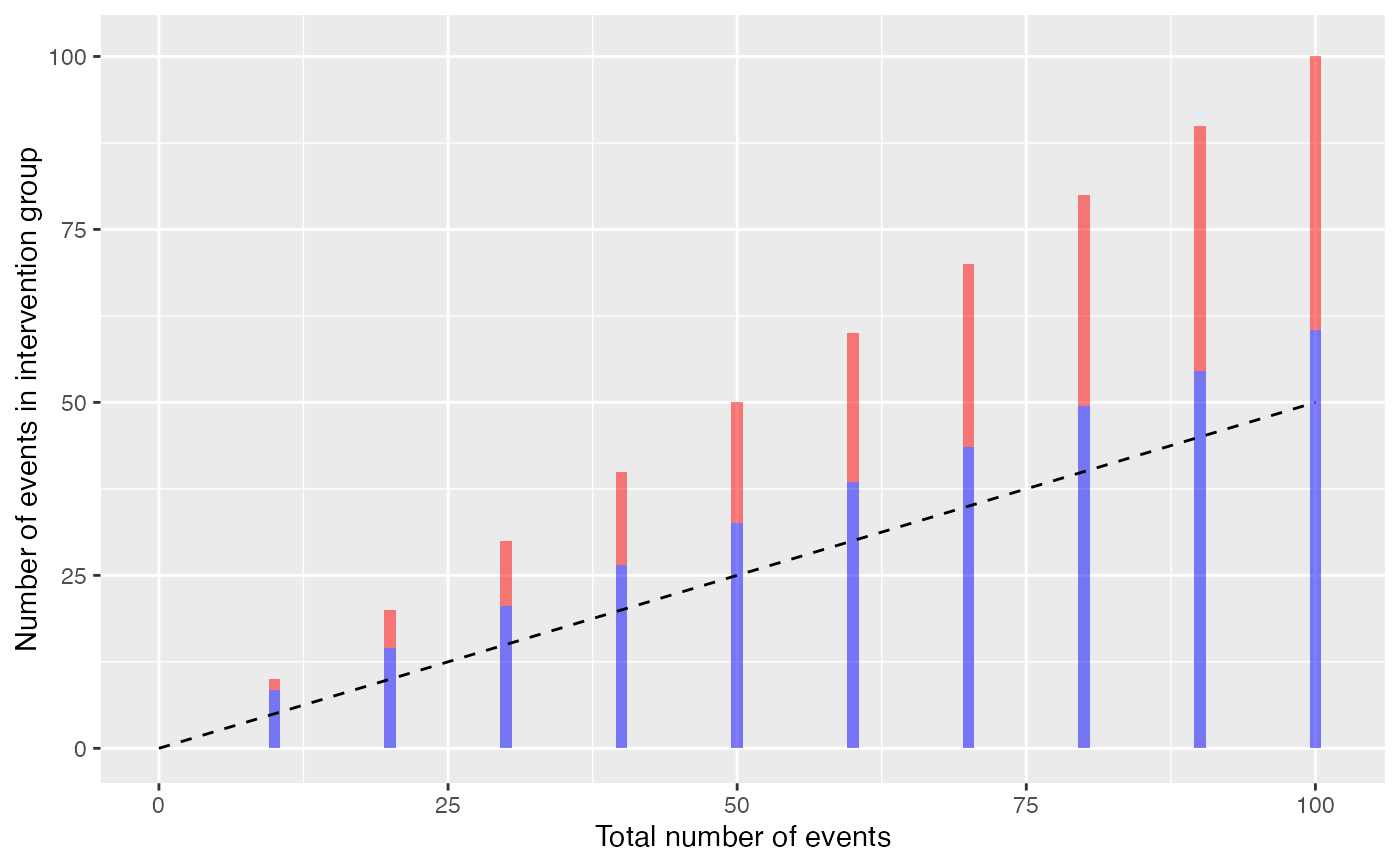 plot(harmbound, which = "abs_stopping")
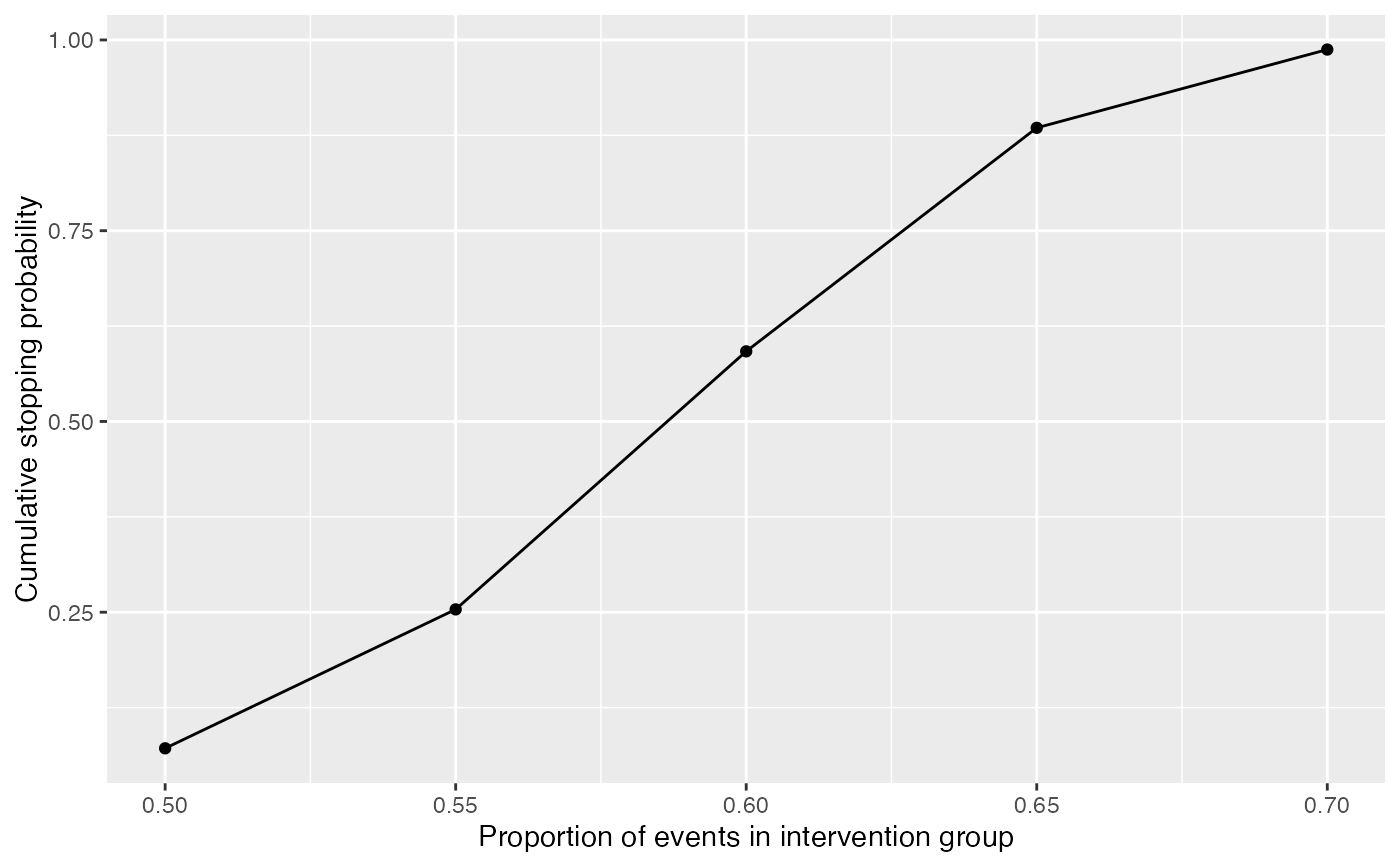
 plot(harmbound, which = "cum_stopping")
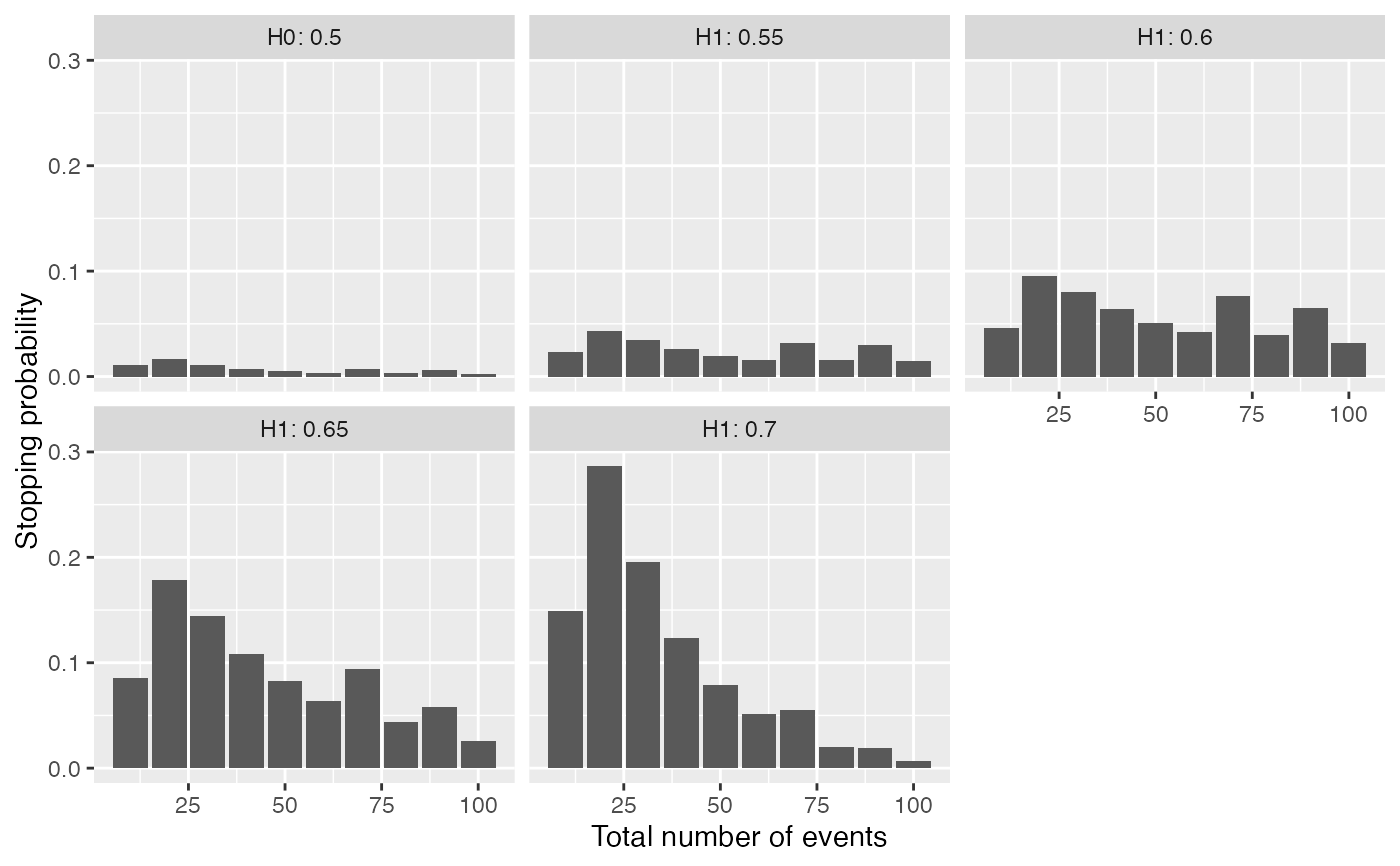
 plot(harmbound, which = "opchar_stop")
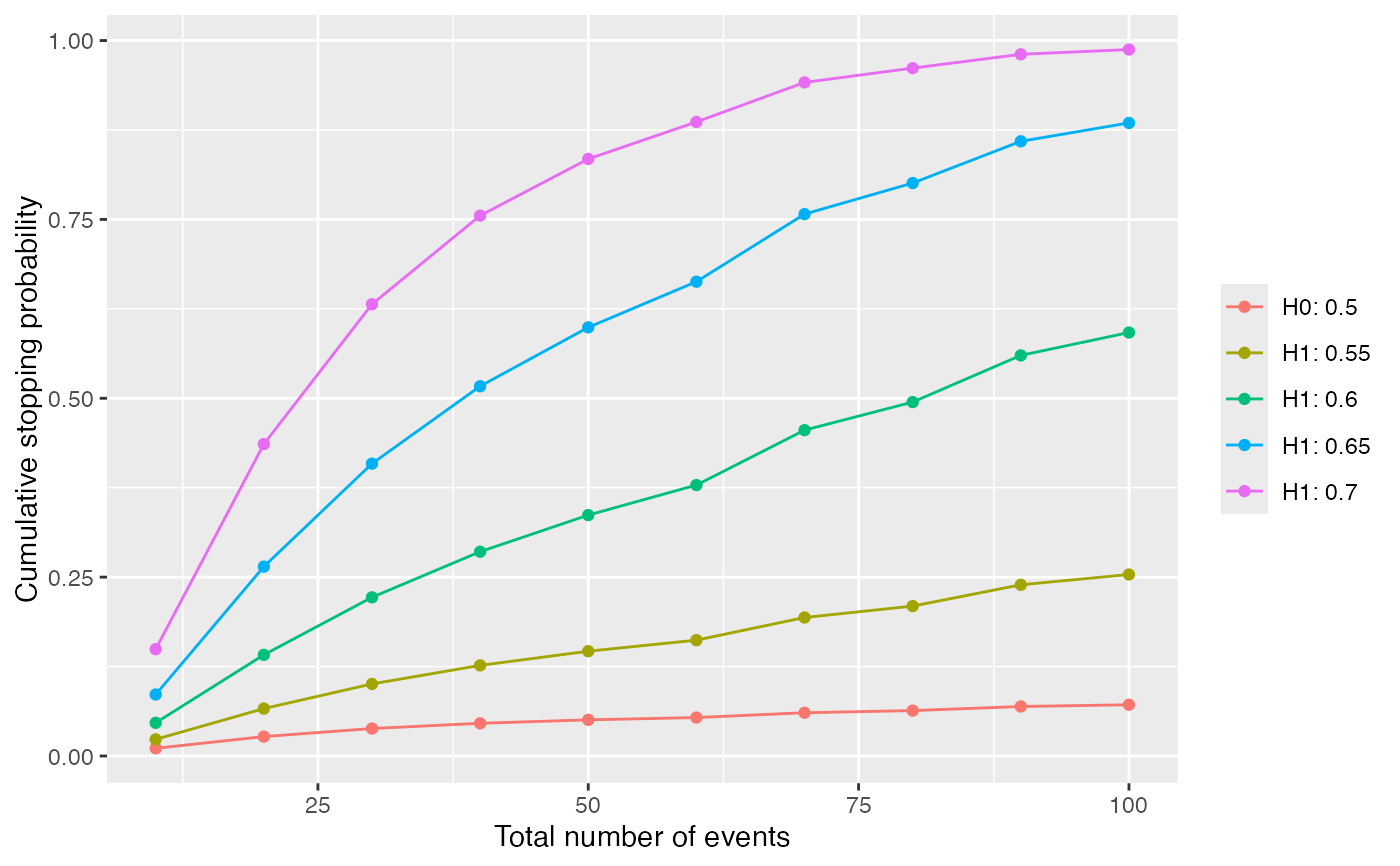
 plot(harmbound, which = "opchar_n")