Time of day figure(s)
fab_tod.RdIn a normal setting it may be that observations that occur at night are
indicative of data fabrication. fab_tod (short for fabrication, time
of day), produces a plot that may help to identify problems. Customs vary in
different countries, so that should be accounted for when interpreting these
figures.
Arguments
- data
data frame containing
var(and, optionally,by) variable(s)- var
string. Name of variable containing relevant datetimes
- by
string. Name of variable denoting grouping
- dow_fmt
format for day of week
- output
output format
facetcombines figures via ggplot2::facet_wrap,listreturns a list of ggplot2 plots- col_poly
colour to use for the region indicating possible fabrication
- x_poly
x coordinates for the start and end of the region indicating possible fabrication
- col_bars
colour to use for bars indicating counts
Details
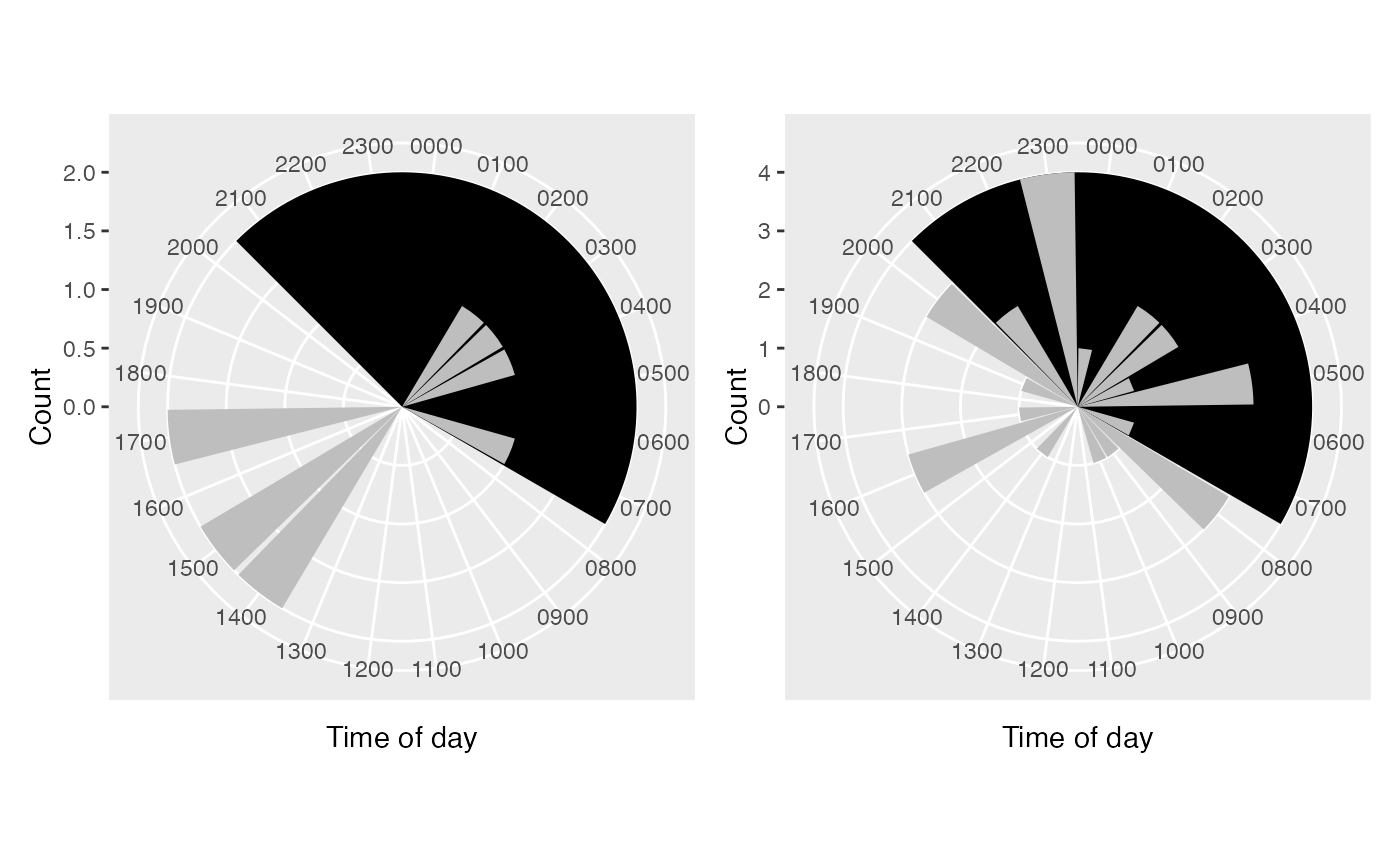
Due to a limitation of faceting plots with polar coordinates, faceted plots all have the same y coordinate (equivalent to fixed axes). To free the coordinate system, use the list output (default) and wrap them together using e.g. patchwork, possibly applying some customizations in advance.
Examples
set.seed(234)
dat <- data.frame(
x = lubridate::ymd_h("2020-05-01 14") + 60^2*sample(0:20, 40, TRUE),
by = c(rep(1, 10), rep(2, 30))
)
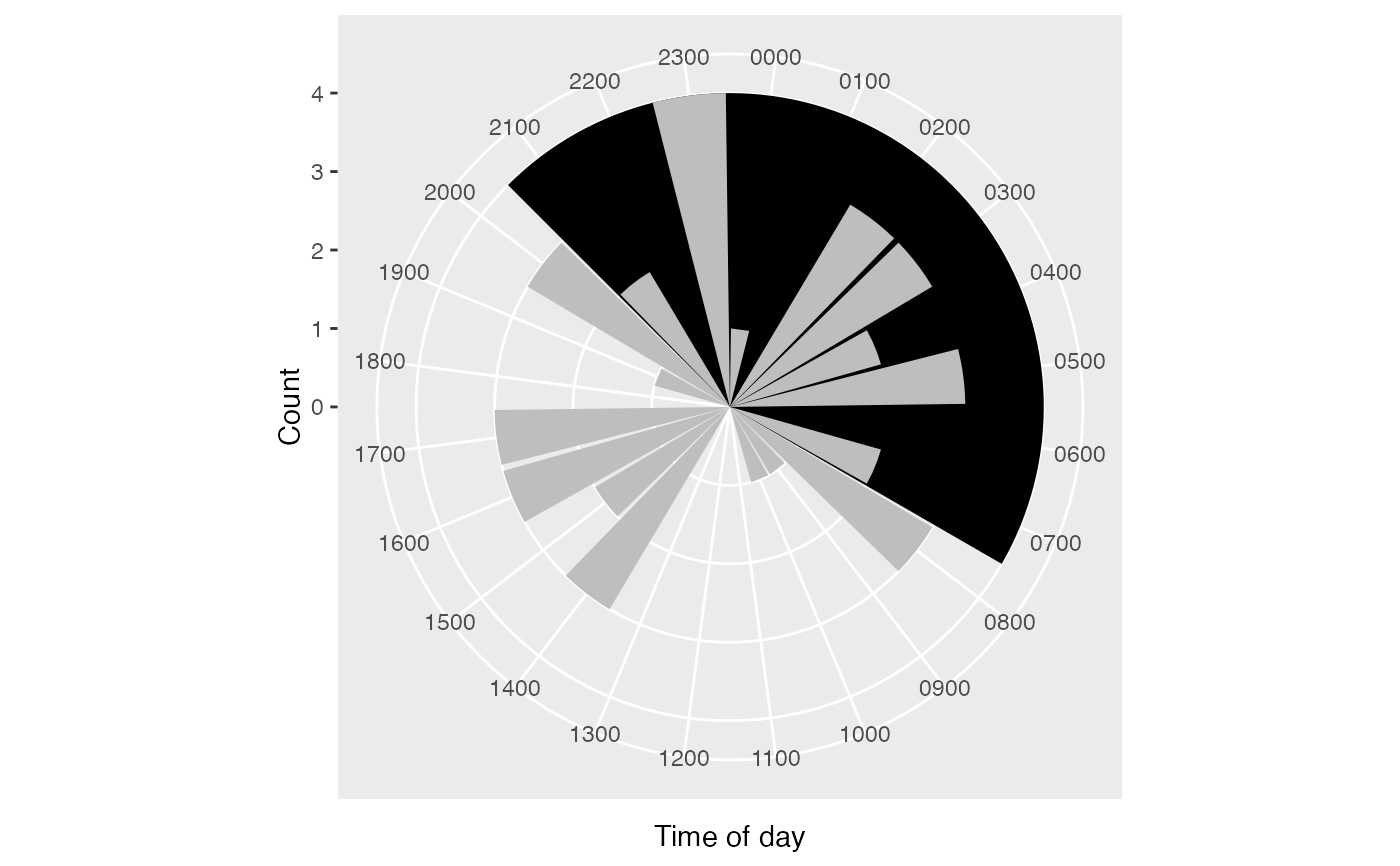
dat %>% fab_tod("x")
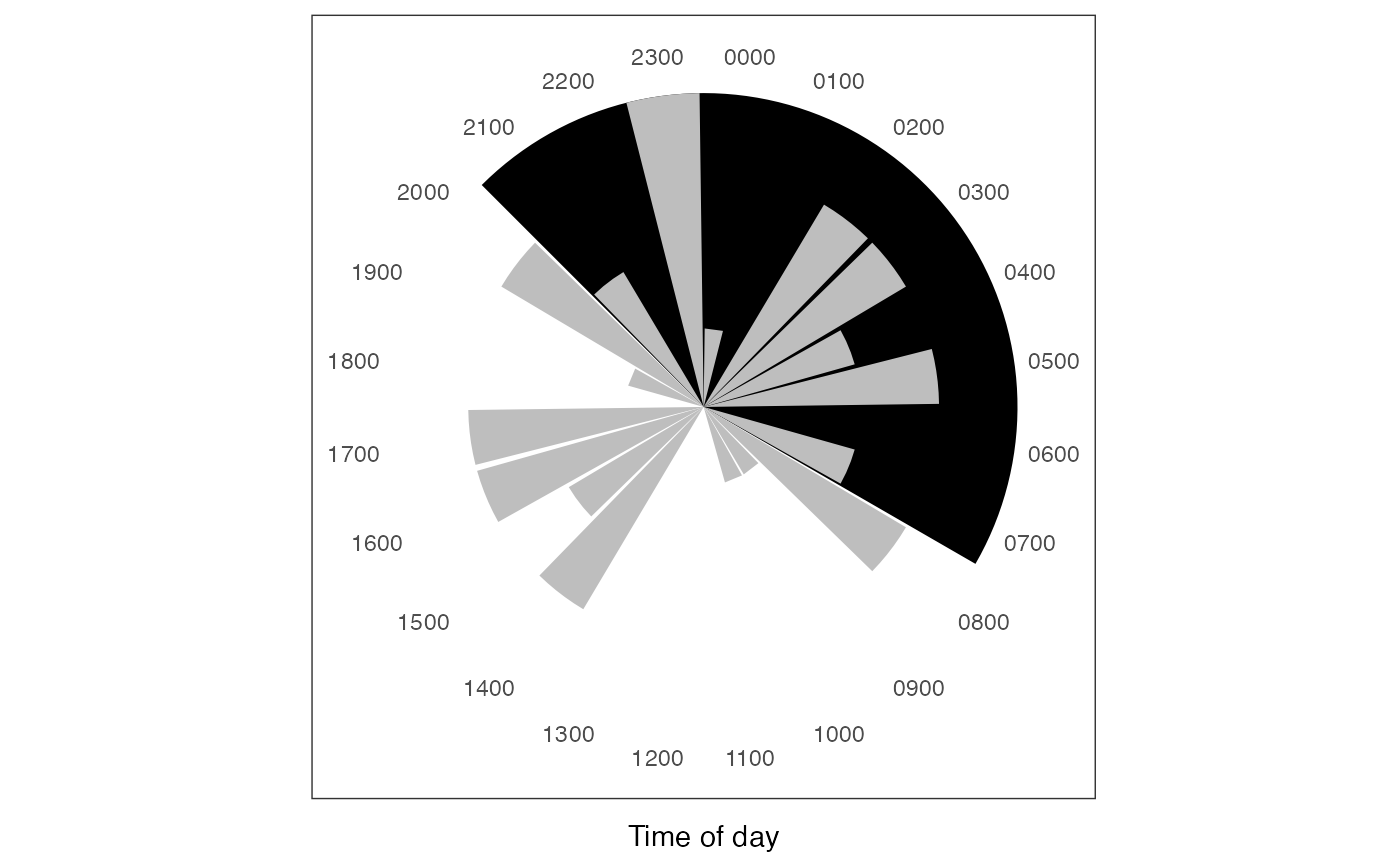
 dat %>% fab_tod("x") + theme_kpitools()
 dat %>% fab_tod("x", "by")
#> $`1`
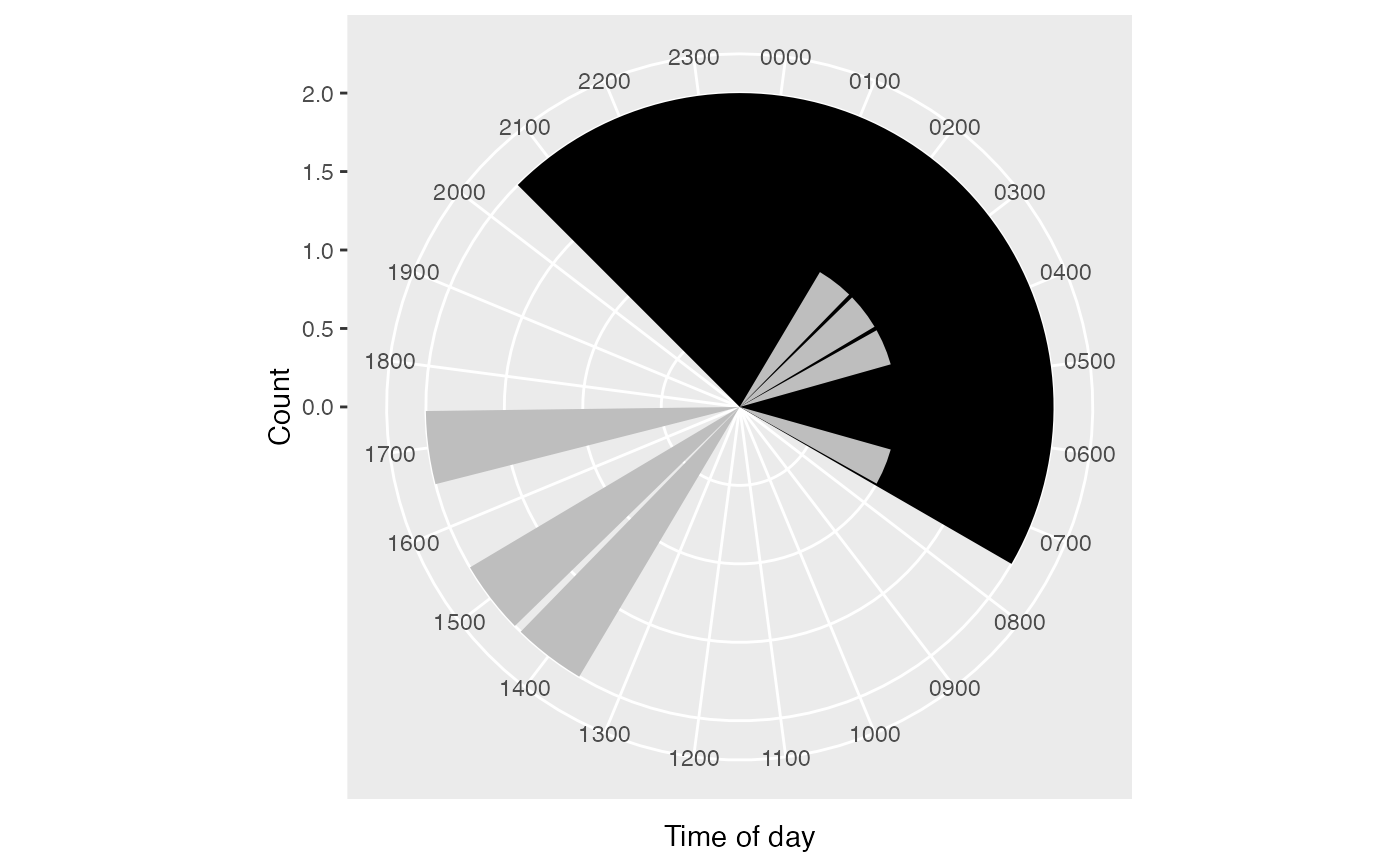 #>
#> $`2`
#>
#> $`2`
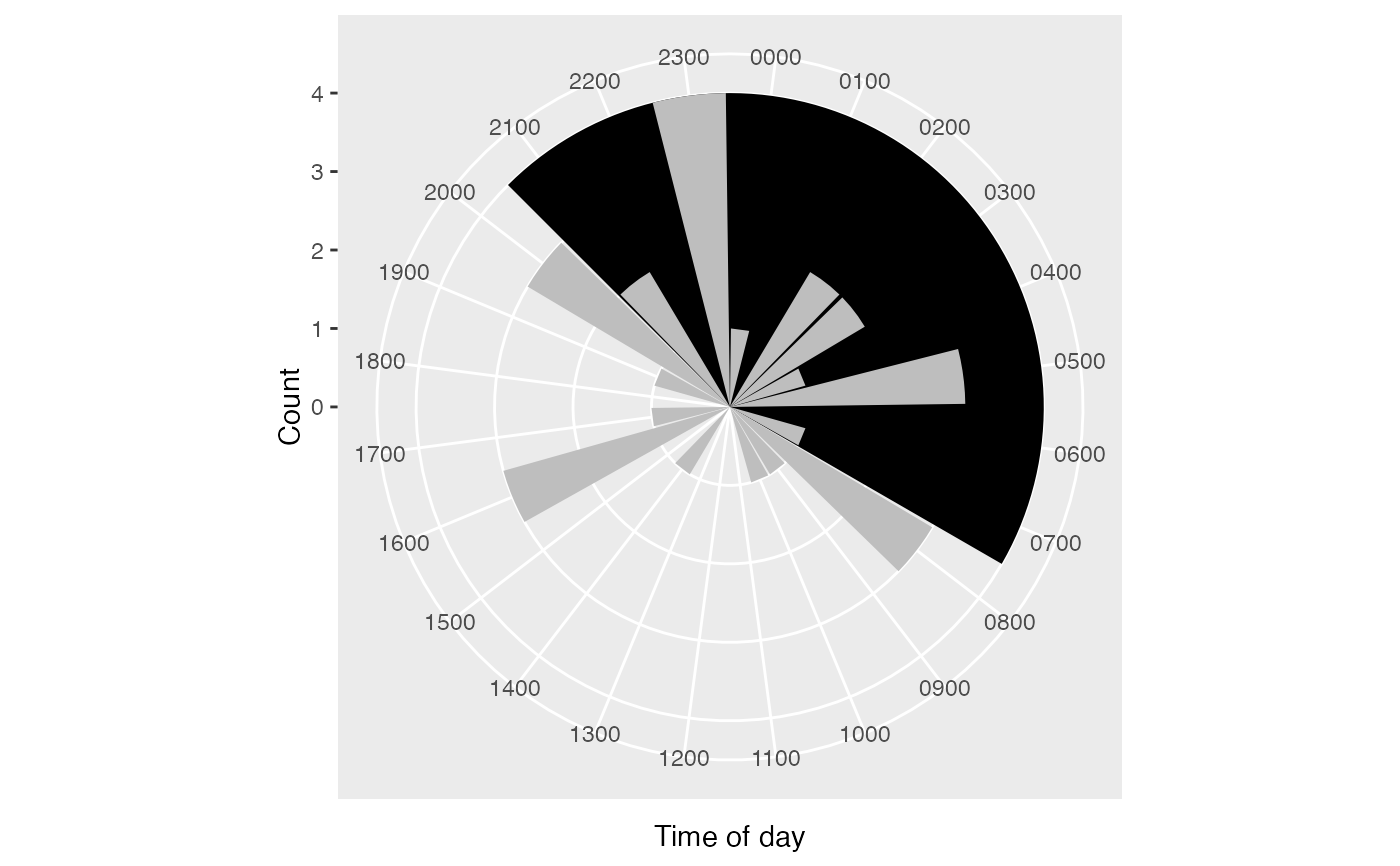 #>
#faceted of plots
dat %>% fab_tod("x", "by", output = "facet")
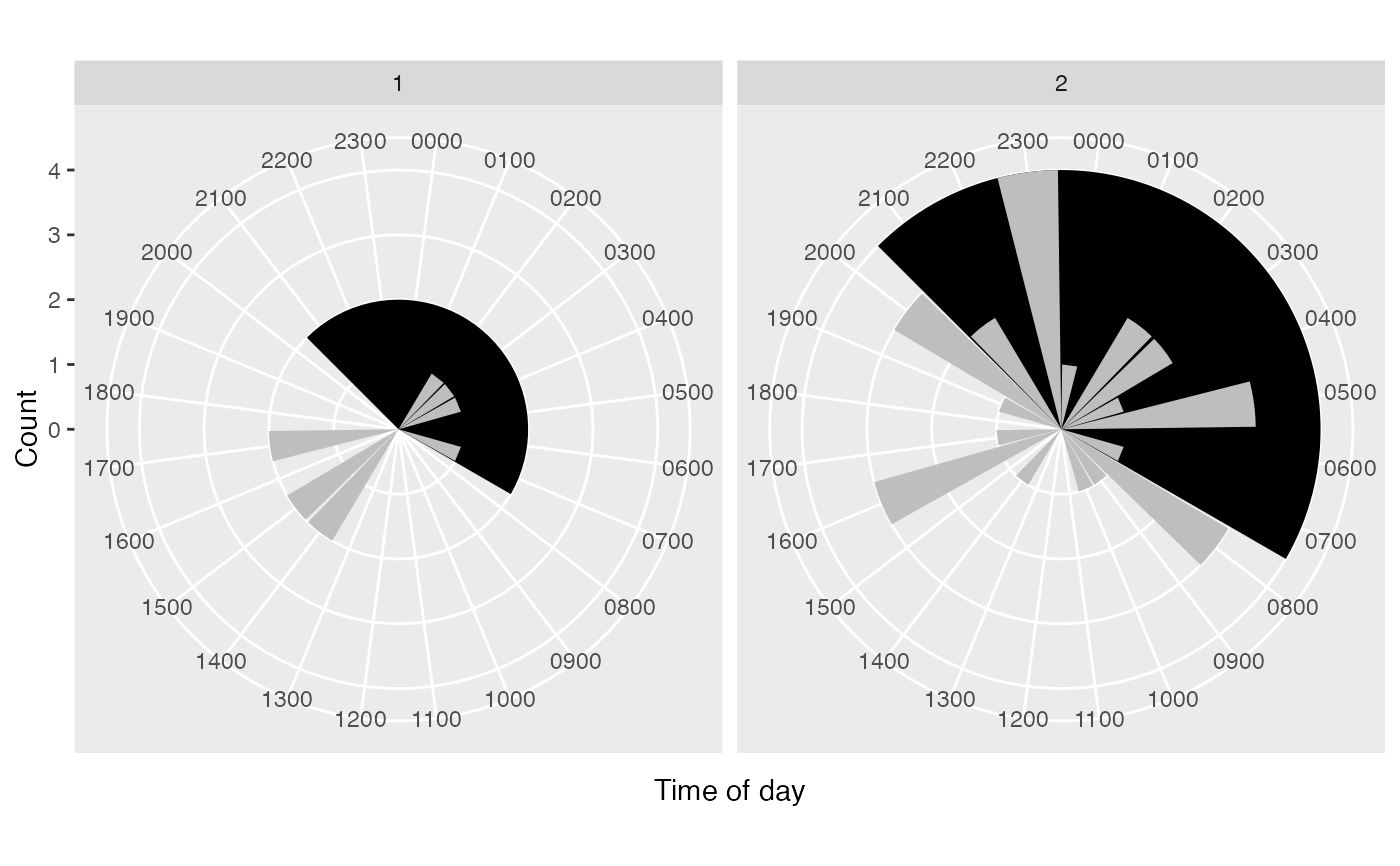 #with patchwork
patchwork::wrap_plots(dat %>% fab_tod("x", "by"))
