![]()
![]()
Accrual plots are an important tool when monitoring clinical trials. Some trials are terminated early due to low accrual, which is a waste of resources (including time). Assessing accrual rates can also be useful for planning analyses and estimating how long a trial needs to continue recruiting participants. accrualPlot provides tools for such plots
Installation
accrualPlot can be installed from CRAN in the usual manner:
install.packages('accrualPlot')The development version of the package can be installed from the CTU Bern universe via
install.packages('accrualPlot', repos = c('https://ctu-bern.r-universe.dev', 'https://cloud.r-project.org'))accrualPlot can be installed directly from from github with:
# install.packages("remotes")
remotes::install_github("CTU-Bern/accrualPlot")
Note that remotes treats any warnings (e.g. that a certain package was built under a different version of R) as errors. If you see such an error, run the following line and try again:
Sys.setenv(R_REMOTES_NO_ERRORS_FROM_WARNINGS = "true")Overview
The first step to using accrualPlot is to create an accrual dataframe. This is simply a dataframe with a counts of participants included per day.
# load package
library(accrualPlot)
#> Loading required package: lubridate
#>
#> Attaching package: 'lubridate'
#> The following objects are masked from 'package:base':
#>
#>     date, intersect, setdiff, union

# demonstration data
data(accrualdemo)

df <- accrual_create_df(accrualdemo$date)
Cumulative and absolute recruitment plots , as well as a method to predict the time point of study completion, are included.
par(mfrow = c(1,3))
plot(df, which = "cum")
plot(df, which = "abs")
plot(df, which = "pred", target = 300)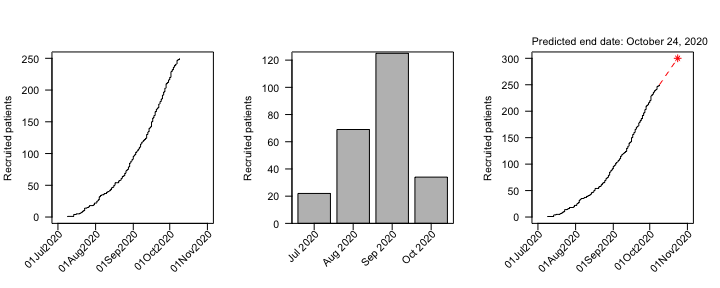
Acknowledgements
The package logo was created with ggplot2 and hexSticker with icons from Font Awesome (via the emojifont package).