Plot method for accrual data frames produced by accrual_create_df
Source: R/methods.R
plot.accrual_df.RdPlot method for accrual data frames produced by accrual_create_df
Examples
data(accrualdemo)
accrual_df <- accrual_create_df(accrualdemo$date)
plot(accrual_df)
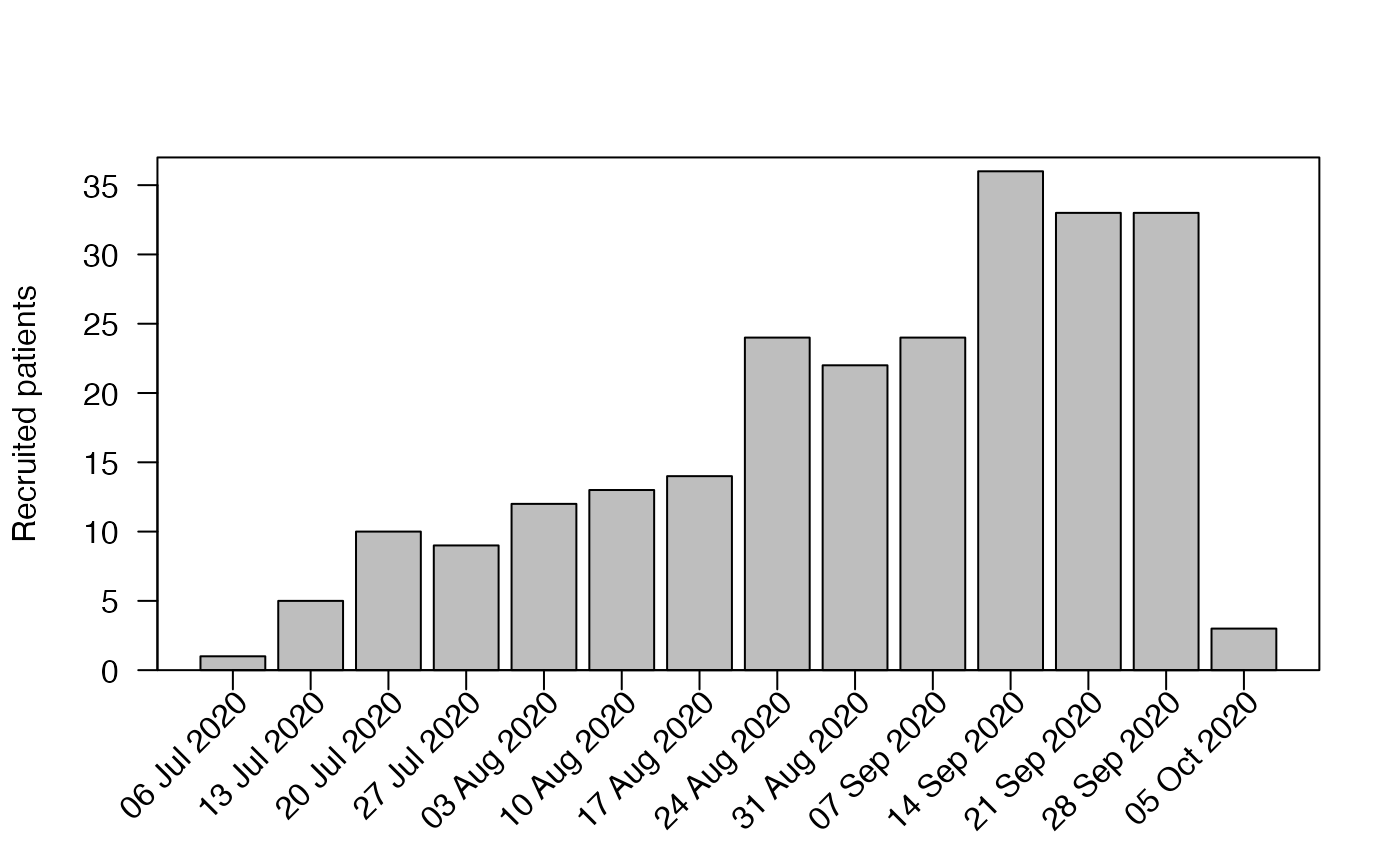
 plot(accrual_df, "abs", unit="week")
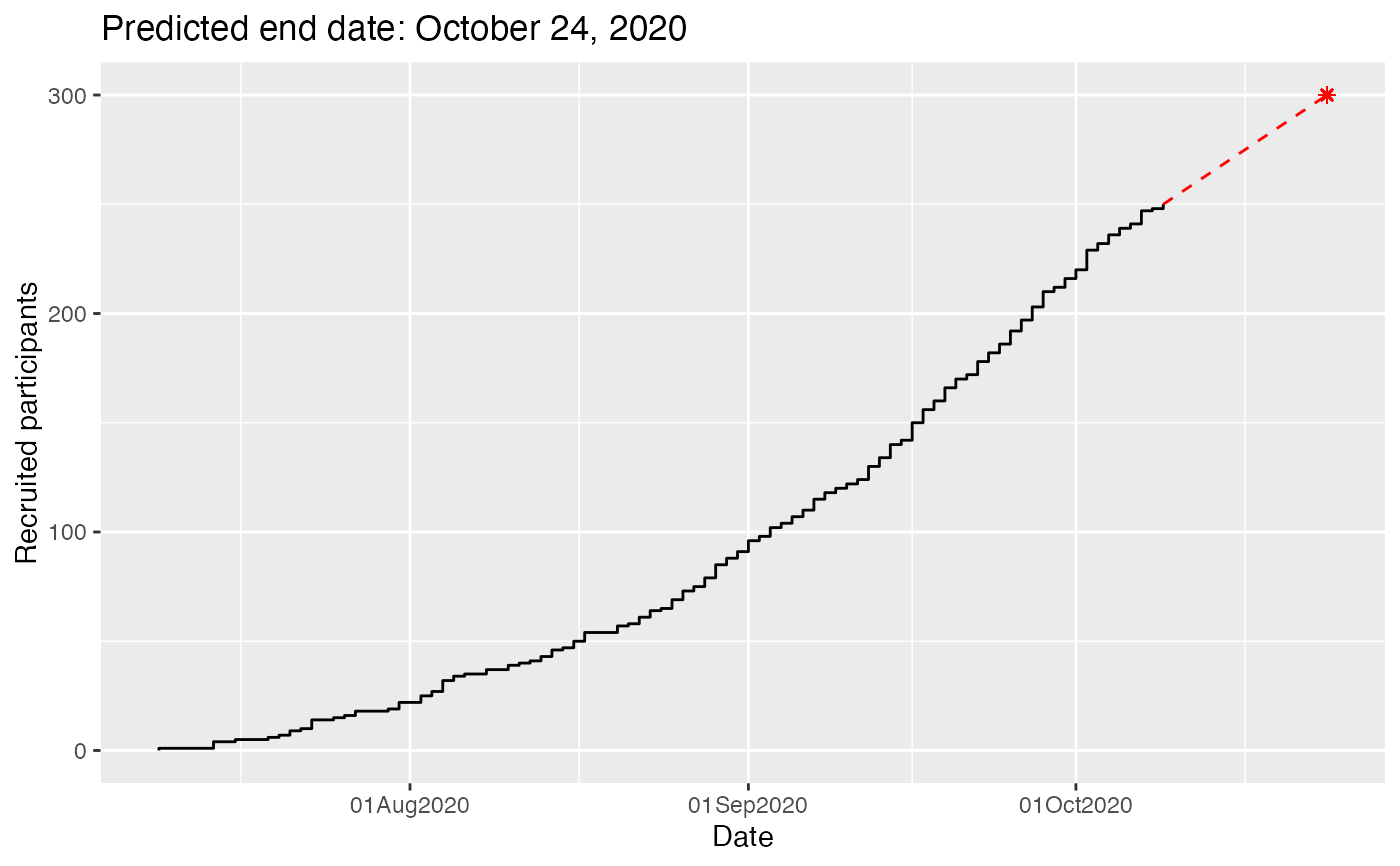
 plot(accrual_df, "pred", target = 300)
 plot(accrual_df, "pred", target = 300, engine = "ggplot")
#> Warning: All aesthetics have length 1, but the data has 79 rows.
#> ℹ Please consider using `annotate()` or provide this layer with data containing
#> a single row.
plot(accrual_df, "pred", target = 300, engine = "ggplot")
#> Warning: All aesthetics have length 1, but the data has 79 rows.
#> ℹ Please consider using `annotate()` or provide this layer with data containing
#> a single row.